本文介绍SpringBoot如何使用Prometheus配合Grafana监控。
关于Prometheus
Prometheus是一个根据应用的metrics来进行监控的开源工具。相信很多工程都在使用它来进行监控,有关详细介绍可以查看官网:https://prometheus.io/docs/introduction/overview/。
有关Grafana
Grafana是一个开源监控利器,如图所示。
从图中就可以看出来,使用Grafana监控很高大上,提供了很多可视化的图标。
官网地址:https://grafana.com/
SpringBoot使用Prometheus
依赖内容
在SpringBoot中使用Prometheus其实很简单,不需要配置太多的东西,在pom文件中加入依赖,完整内容如下所示。
|
配置文件
配置文件中加入配置,这里就只进行一些简单配置,management.metrics.tags.application属性是本文配合Grafana的Dashboard设置的,如下所示:
spring.application.name=springboot_prometheus |
设置application
修改启动类,如下所示.
|
SpringBoot项目到这里就配置完成了,启动项目,访问http://localhost:8080/actuator/prometheus, 如图所示,可以看到一些度量指标。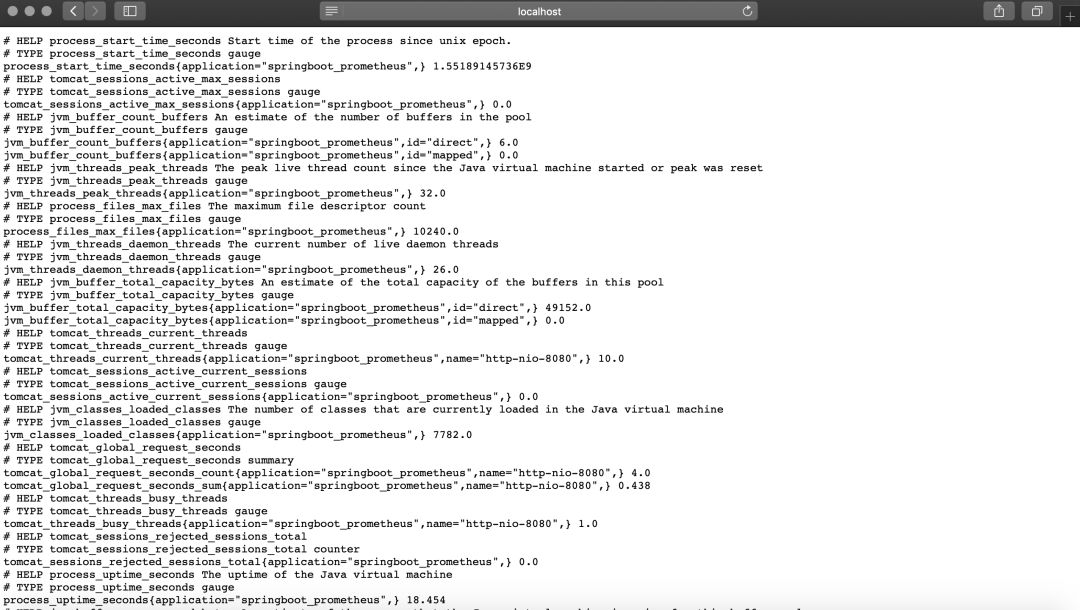
Prometheus配置
配置应用
在prometheus配置监控我们的SpringBoot应用,完整配置如下所示。
# my global config |
启动Prometheus
启动Prometheus,浏览器访问,查看Prometheus页面,如图所示。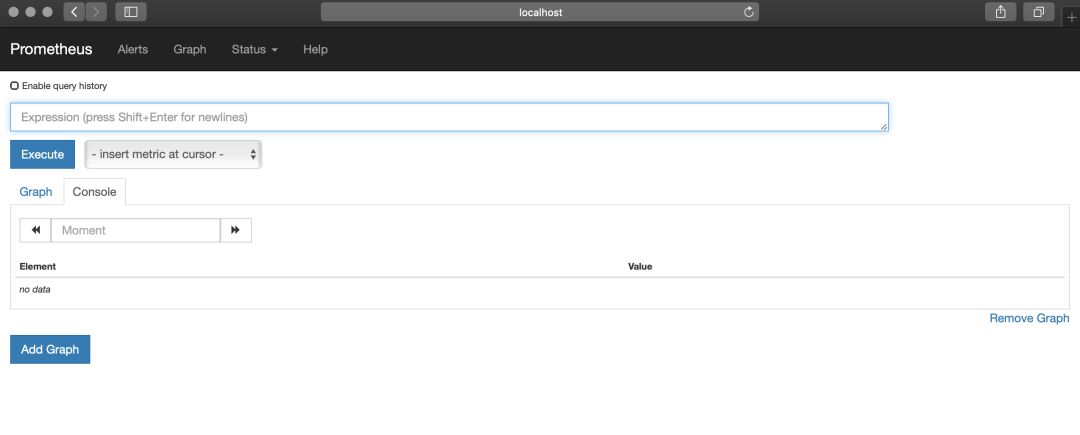
点击如图所示位置,可以查看Prometheus监控的应用。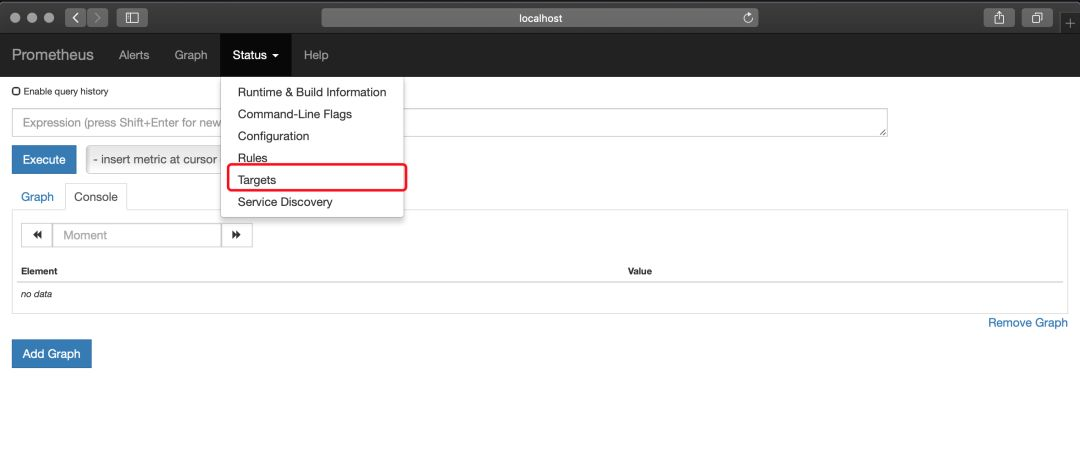
列表中UP的页面为存活的实例,如图所示。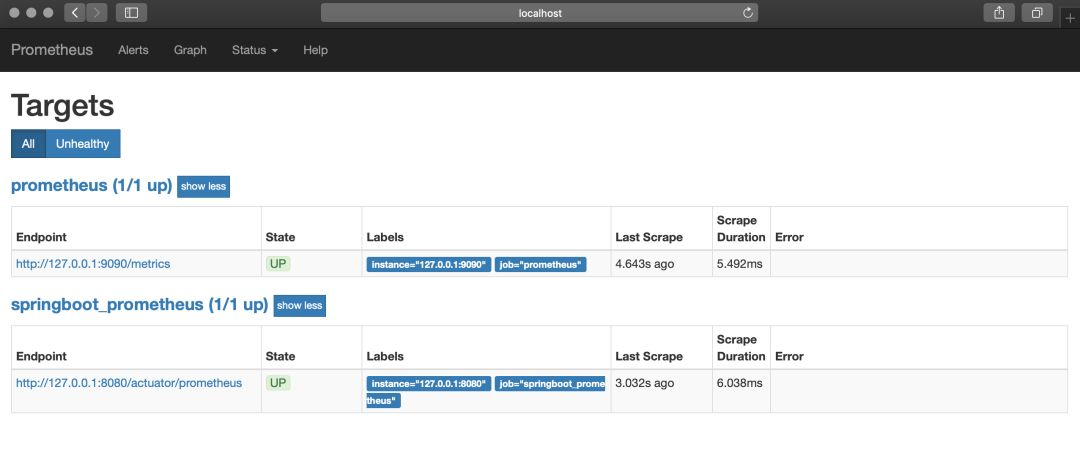
也可以查看很多指数,如下所示。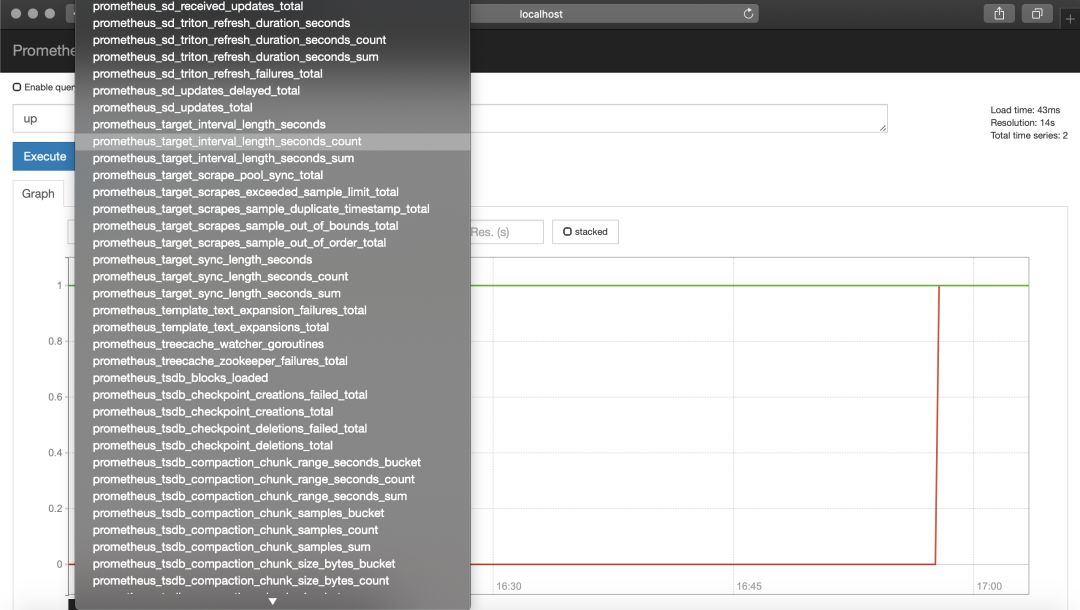
Grafana配置
启动Grafana,配置Prometheus数据源,这里以ID是4701的Doshboard为例(地址:https://grafana.com/dashboards/4701 )如图。
在Grafana内点击如图所示import按钮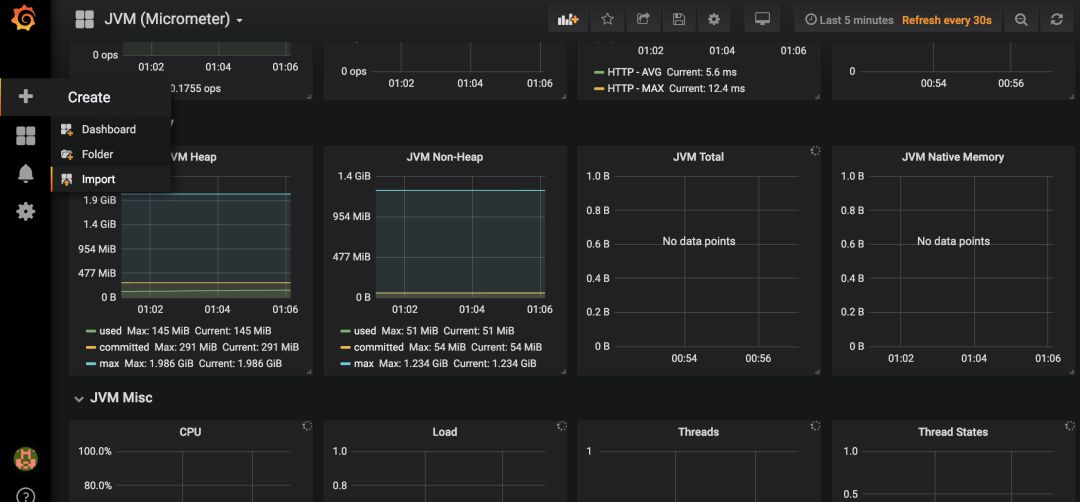
在如图所示位置填写4701,然后点击load。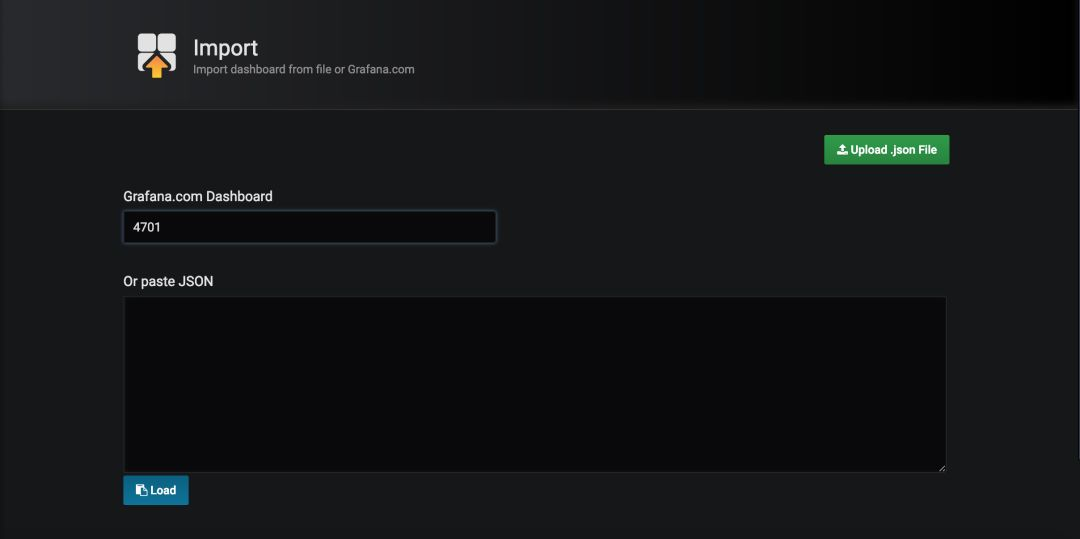
接下来导入Doshboard。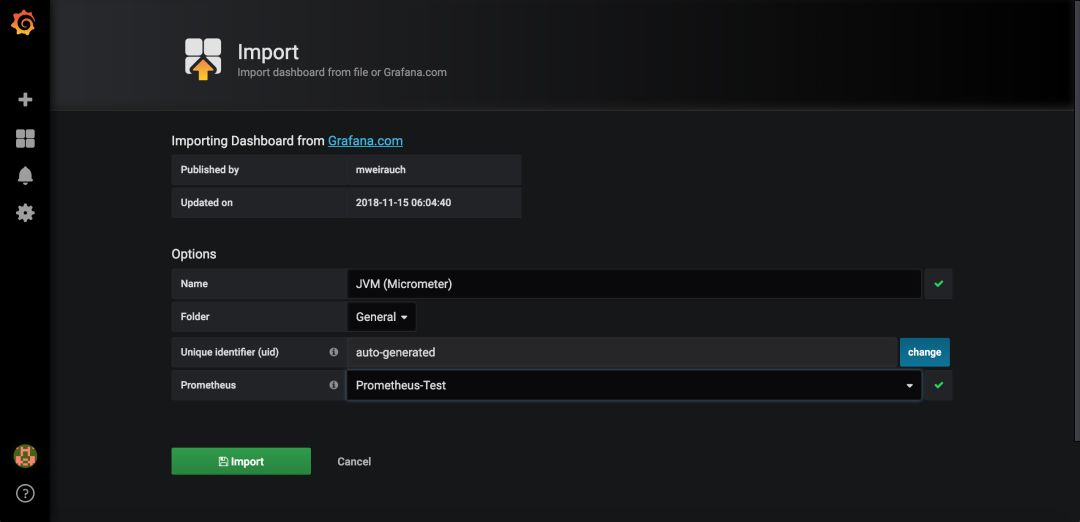
导入后就可以看到我们的SpringBoot项目对应的指标图表了,如图。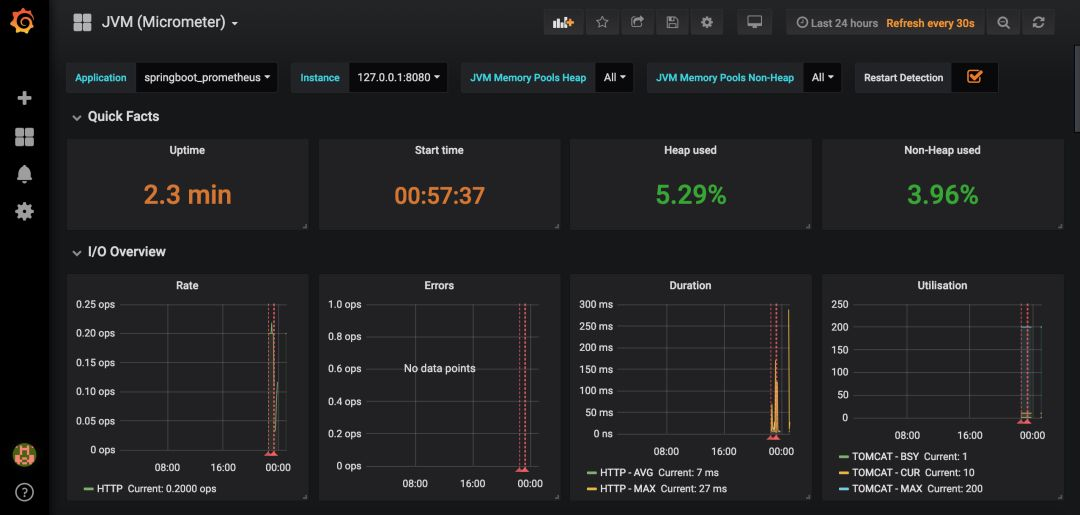
源码
源码地址:https://gitee.com/dalaoyang/springboot_learn/tree/master/springboot2_prometheus